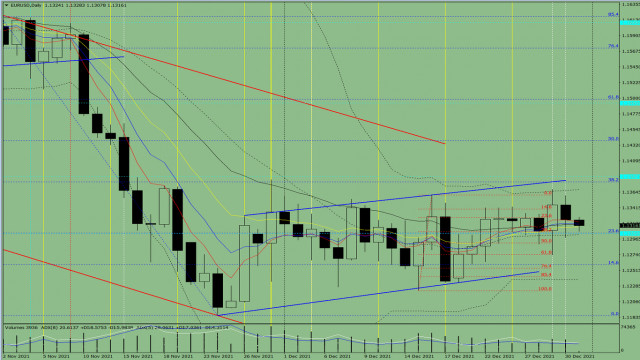
Trend analysis (Fig. 1)
The price from the level of 1.1324 (closing of yesterday's daily candle) may continue to decline today in order to reach the lower fractal – 1.1298 (daily candle from 12/30/2021). Once this level is tested, it is likely to resume its growth to the target of 1.1369 – the upper border of the Bollinger line indicator (black dotted line).
Fig. 1 (daily chart)
Comprehensive analysis:
* Indicator analysis - down
* Fibonacci levels - down
* Volumes - up
* Candlestick analysis - up
* Trend analysis - up
* Bollinger lines - up
* Weekly chart - up
General conclusion:
Today, the price from the level of 1.1324 (closing of yesterday's daily candle) may resume its downward movement to be able to reach the lower fractal – 1.1298 (daily candle from 12/30/2021). After testing it, it may rise again to the target of 1.1369 – the upper border of the Bollinger line indicator (black dotted line).
Alternatively, the price from the level of 1.1324 (closing of yesterday's daily candle) may continue to fall so that it can reach the lower fractal – 1.1273 (daily candle from 12/29/2021). After this level is tested, it may surge to the target of 1.1317 – 21 average EMA (black thin line).The material has been provided by InstaForex Company - www.instaforex.com
http://dlvr.it/SGJPlH

No comments:
Post a Comment