Outlook for GBP/USD on January 29. The pound approaches the two central bank meetings in a great mood
GBP/USD traded chaotically and moved in different directions throughout Friday. However, there is nothing surprising about it, considering that the price has been stuck between the levels of 1.2610 and 1.2786 for the past month and a half. The flat persists, and movements within the flat have always been highly unpredictable, defying technical analysis.
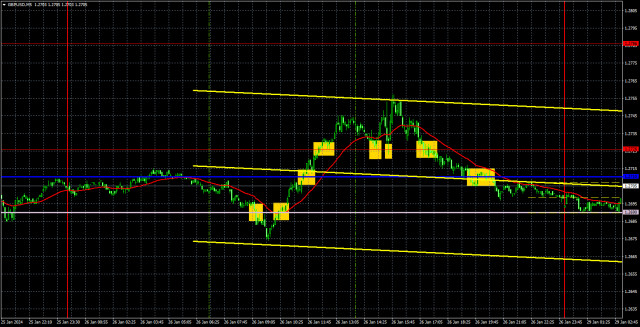
Nevertheless, an uptrend has even formed within the sideways channel in recent weeks, as shown by the trendline on the hourly timeframe. Therefore, as long as the price does not firmly close below this trendline, we can still expect movement towards the upper boundary of the sideways channel – the level of 1.2786. Currently, the price is in between the Senkou Span B and Kijun-sen lines, as well as near the trendline. There's a high probability of a bullish reversal, but it is important to remember that this is still a flat, and movements within a flat can be entirely random.
It is also important not to forget that this week, we will see a significant number of important fundamental and macroeconomic events that are likely to have a strong impact on market sentiment. Therefore, this week might be a serious contender for the end of the flat. However, as usual, everything will depend on the nature of these events. If the British support the pound and the Americans support the dollar, and, technically, there's still a possibility that nothing will change. The pair may still remain within the bounds of the sideways channel.
Several trading signals were generated on Friday, as the price was in an area where two lines and one level converged. The first sell signal near the Senkou Span B line turned out to be false, resulting in a small loss. Subsequently, a buy signal was formed near the same line, after which the price crossed the Kijun-sen and the level of 1.2726. Traders had ample time to close long positions at a decent profit. Two more sell signals were formed by the end of the day, but there was no point in executing them as they were generated too late.
COT report:
COT reports on the British pound show that the sentiment of commercial traders has been changing quite frequently in recent months. The red and green lines, representing the net positions of commercial and non-commercial traders, often intersect and, in most cases, are close to the zero mark. According to the latest report on the British pound, the non-commercial group opened 6,300 buy contracts and 5,800 short ones. As a result, the net position of non-commercial traders increased by 500 contracts in a week. The fundamental backdrop still does not provide a basis for long-term purchases on the pound.
The non-commercial group currently has a total of 72,600 buy contracts and 41,100 sell contracts. Since the COT reports do not provide an accurate forecast of the market's behavior at the moment, we need to pay closer attention to the technical picture and economic reports. However, even these types of analysis are currently secondary because, despite everything, the market maintains a bullish bias towards the pound, and the price has been in a flat range for the second month. The technical analysis suggests that there's a possibility that the pound could show a pronounced downward movement (but there are no clear sell signals yet), and for a long time now, the economic reports have also been significantly stronger in the United States than in the United Kingdom, but this has not benefited the dollar.
Analysis of GBP/USD 1H
On the 1H chart, GBP/USD continues to move higher after bouncing from the 1.2605-1.2620 area. The wide sideways channel is still relevant, and the price has been unable to break out of it for a month and a half. Therefore, it wouldn't be surprising if the pound continues to rise within the flat today.
On Monday, the pair has a higher chance of rising than falling. The price is in the middle of the sideways channel, and the trendline is currently supporting its upward movement. Therefore, we believe that you may consider long positions with 1.2786 as the target, but we should remember that we are dealing with a flat market, and movements could turn out to be random so the price can move in any direction. The Ichimoku indicator lines are currently weak.
As of January 29, we highlight the following important levels: 1.2215, 1.2269, 1.2349, 1.2429-1.2445, 1.2513, 1.2605-1.2620, 1.2726, 1.2786, 1.2863, 1.2981-1.2987. The Senkou Span B (1.2690) and Kijun-sen (1.2710) lines can also serve as sources of signals. Don't forget to set a breakeven Stop Loss to breakeven if the price has moved in the intended direction by 20 pips. The Ichimoku indicator lines may move during the day, so this should be taken into account when determining trading signals.
On Monday, there are no important events lined up in the UK and the US. Therefore, it is unlikely for the flat to end today, or volatility to be high.
Description of the chart:
Support and resistance levels are thick red lines near which the trend may end. They do not provide trading signals;
The Kijun-sen and Senkou Span B lines are the lines of the Ichimoku indicator, plotted to the 1H timeframe from the 4H one. They provide trading signals;
Extreme levels are thin red lines from which the price bounced earlier. They provide trading signals;
Yellow lines are trend lines, trend channels, and any other technical patterns;
Indicator 1 on the COT charts is the net position size for each category of traders;
Indicator 2 on the COT charts is the net position size for the Non-commercial group.The material has been provided by InstaForex Company - www.instaforex.com
http://dlvr.it/T21MMV
Comments
Post a Comment