Well, the New Year's week begins. And the euro/dollar pair meets it inside the same side channel, which we have already talked and written about more than once. On the 4-hour timeframe (illustration below), it is visible that the pair has been flat for several weeks. Bollinger bands are not ideally directed sideways, but still, their orientation cannot be called ascending or descending. But in the 24-hour timeframe, everything is perfectly visible and understandable. After another round of downward movement, a flat began, and the Bollinger bands narrowed and turned sideways. Thus, the Ichimoku indicator lines are not strong inside the outright flat. This applies to both 4-hour TF and 24-hour. Accordingly, first of all, you need to wait for the flat to end.
As for the "foundation" and "macroeconomics", next week, there will be neither one nor the other. And nothing is surprising in this, since the week is New Year's. Thus, the volatility of the euro/dollar pair may remain low, although this assumption is twofold. On the one hand, it is logical, since many traders will leave the market, and those who remain will have nothing to react to. On the other hand, in the conditions of a "thin" market, there may be movements of the pair, even if there is no "foundation". Thus, the "festive" status of the week does not mean that the pair will stand in one place. But to leave the side channel, it will have to work hard, and we do not believe that this will happen on New Year's Eve.
Separately, I would like to mention the "coronavirus". In the last week, in the absence of other news and events, everyone has been discussing it, as well as a new strain of "omicron", which is less dangerous, but more contagious. However, the markets are still not responding to this news in any way. Therefore, if the situation continues to deteriorate, then theoretically there may be a panic, which, of course, will lead to strong movements in the foreign exchange market, but for this everything must become much worse than it is now.
Trading recommendations for the EUR/USD pair:
The technical picture of the EUR/USD pair on the 4-hour chart according to the Ichimoku strategy looks extremely eloquent. Bollinger bands have been directed sideways for most of the last four weeks, which signals a flat. The pair is located between the levels of 1.1236 and 1.1360. For most of the past week, the pair was in a one-way upward movement, but even this did not lead to the pair's exit from the side channel. Thus, the lines of the Ichimoku indicator have practically no meaning now. You need to wait for the flat to end or trade for a rebound from the upper or lower boundaries of the channel.
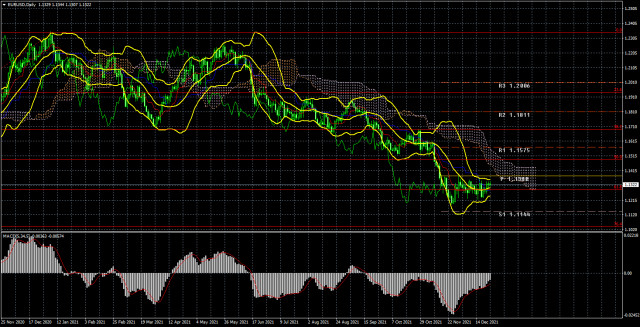
Explanations to the illustrations:
Price levels of support and resistance (resistance /support), Fibonacci levels - target levels when opening purchases or sales. Take Profit levels can be placed near them.
Ichimoku indicators (standard settings), Bollinger Bands (standard settings), MACD (5, 34, 5).The material has been provided by InstaForex Company - www.instaforex.com
http://dlvr.it/SG2hpD
Comments
Post a Comment