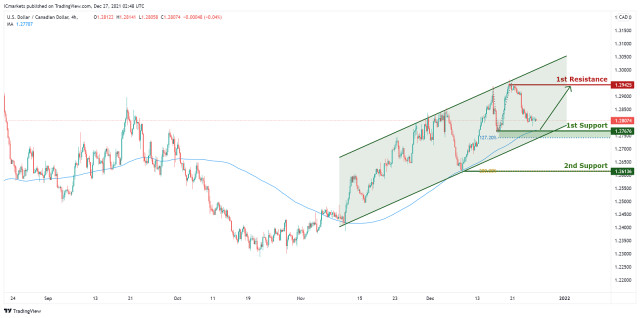
On the H4 time frame, with price approaching the support of the stochastics indicator, we have a bullish bias that price will rise from 1st support at 1.27676 in line with the graphical swing low support and 127.2% Fibonacci extension to 1st resistance at 1.29425 in line with the graphical swing high resistance. Alternatively, we may see price break 1st support and head for 2nd support at 1.26136 in line with the horizontal swing low support and 200% Fibonacci projection.
Trading Recommendation
Entry:1.27676
Reason for Entry:
Graphical swing low support and 127.2% Fibonacci extension
Take Profit: 1.29425
Reason for Take Profit:
Graphical swing high resistance
Stop Loss:1.26136
Reason for Stop Loss:
Horizontal swing low support and 200% Fibonacci projection. The material has been provided by InstaForex Company - www.instaforex.com
http://dlvr.it/SG4g59
Comments
Post a Comment