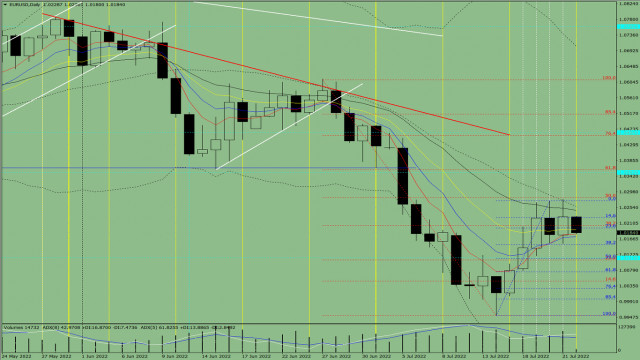
Trend analysis (Fig. 1).
The euro-dollar pair may move downward from the level of 1.0229 (close of yesterday's daily candle) to 1.0150, the 38.2% retracement level (blue dotted line). After testing this level, an upward movement is possible with the target of 1.0282, the 50.0% retracement level (red dotted line). Upon reaching this level, the price may move up.
Fig. 1 (daily chart).
Comprehensive analysis:
* Indicator analysis – up;
* Fibonacci levels – up;
* Volumes – up;
* Candlestick analysis – up;
* Trend analysis – up;
* Bollinger bands – down;
* Weekly chart – up.
General conclusion:
Today, the price may move downward from the level of 1.0229 (close of yesterday's daily candle) to 1.0150, the 38.2% retracement level (blue dotted line). After testing this level, an upward movement is possible with the target of 1.0282, the 50.0% retracement level (red dotted line). Upon reaching this level, the price may move up.
Alternative scenario: from the level of 1.0229 (close of yesterday's daily candle), the price may move downward to 1.0150, the 38.2% retracement level (blue dotted line). After testing this level, a downward movement is possible with the target of 1.0135, the 50.0% retracement level (blue dotted line). When testing this level, the price may move up.The material has been provided by InstaForex Company - www.instaforex.com
http://dlvr.it/SVJxQ6
Comments
Post a Comment