Yesterday, several entry signals were formed. Let's take a look at the 5-minute chart and see what happened. In my morning forecast, I paid attention to the level of 1.1806 and recommended making decisions on entering the market from it. A false break in the 1.1806 area at the very beginning of the day gave a signal to buy the pound, which, to my regret, was never realized. I did not see any upward movement, after which the trading continued around 1.1806, completely crossing out the pair's upward potential even at the beginning of this week. In the afternoon, the bulls tried to return above 1.1825, but all that was done was to form a false breakout and a signal to sell the pound further along the trend, which resulted in the pair falling by more than 80 points.
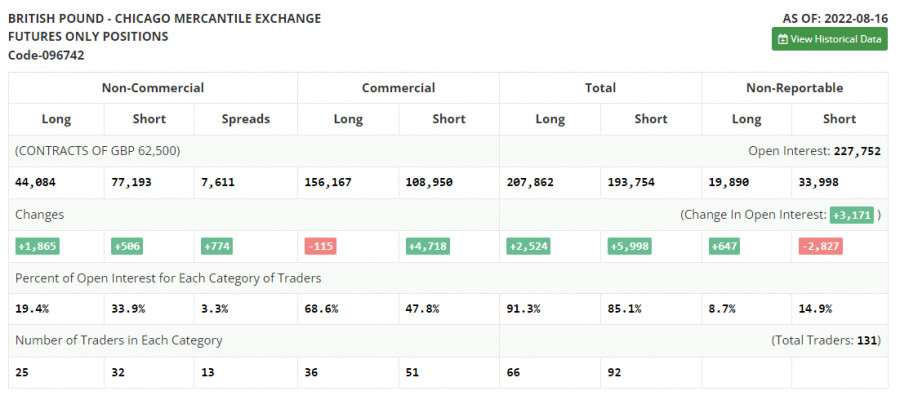
For long positions on GBP/USD:Before analyzing the technical picture of the pound, let's look at what happened in the futures market. In the COT report (Commitment of Traders) for August 16, an increase in both short positions and long positions was recorded, however, these changes no longer reflect the real current picture. Serious pressure on the pair, which began in the middle of last week, continues now, and for sure those who want to buy the pound in the current difficult macroeconomic conditions will become less and less. Ahead of us is a meeting of American bankers in Jackson Hole, which may lead to even greater strengthening of the dollar against the pound. This will happen on the condition that Federal Reserve Chairman Jerome Powell announces the preservation of the committee's previous position regarding the active and tough increase in interest rates, counting on the further fight against inflation and bringing it back to normal. The latest COT report indicated that long non-commercial positions rose 1,865 to 44,084, while short non-commercial positions rose 506 to 77,193, further narrowing the negative non-commercial net position to -33 109 versus -34,468. The weekly closing price remained virtually unchanged at 1.2096 versus 1.2078.
Today we expect quite a large number of fundamental statistics for the UK. Everything will start with data on the index of business activity in the manufacturing sector, the services sector and data on the composite PMI index in the UK. All these indicators are unlikely to show growth, so do not expect anything good. In case of further decline in GBP/USD in the first half of the day, which is more likely, the best scenario for buying will be a false breakdown in the area of the nearest support at 1.1743, which was already tested for strength during yesterday's day. This will lead to a rebound upwards and a jerk to the 1.1782 area, where the average moving averages play on the side of the bears. Only after getting above 1.1782 it will be possible to talk about the prerequisites for building an upward correction for the pair. The breakdown of 1.1782, as well as the reverse downward test opens the way to 1.1820. A more distant target will be the area of 1.1865, where I recommend taking profits. If the GBP/USD falls and there are no buyers at 1.1743, the pressure on the pound will increase again, which will force the bulls to leave the market. If this happens, I recommend postponing long positions to 1.1707 - a major support, below which there is emptiness and new yearly lows. I advise you to buy there only on a false breakdown. You can open long positions on GBP/USD immediately for a rebound from 1.1643, or even lower - in the area of 1.1573 with the aim of correcting 30-35 points within the day.
For short positions on GBP/USD:
Protection of the nearest resistance 1.1782, where the moving averages, playing on the side of the sellers, are almost the most important task for today. Not only weak data on PMI will help in this, but also a negative report on the balance of industrial orders from the Confederation of British Industrialists. If the pair rises on the back of good activity reports in the UK, only the formation of a false break at 1.1782 will return pressure on the pound and form a sell signal with the aim of lowering to the nearest support at 1.1743. A break and back test from the bottom up of this range would provide a sell entry point with a fall towards 1.1707. A more distant target will be the area of 1.1643, where I recommend taking profits. With the GBP/USD growth option and no bears at 1.1782, buyers will have an excellent chance of a return to 1.1820, which will make life difficult for pound sellers. Only a false break around 1.1820 forms an entry point into short positions, counting on a new downward movement of the pair. If there is no activity there, there may be a surge up to the high of 1.1865. There, I advise you to sell GBP/USD immediately for a rebound, based on a rebound of the pair down by 30-35 points within a day.
Indicator signals:
Moving Averages
Trading below the 30 and 50-day moving averages indicates that bears can still push the pair lower.
Please note that the time period and levels of the moving averages are analyzed only for the H1 chart, which differs from the general definition of the classic daily moving averages on the D1 chart.
Bollinger Bands
A breakout of the lower band at 1.1740 will intensify the bearish pressure on the pair. In case the pair advances, the upper band at 1.1780 will serve as resistance.
Description of indicators:
• A moving average of a 50-day period determines the current trend by smoothing volatility and noise; marked in yellow on the chart;
• A moving average of a 30-day period determines the current trend by smoothing volatility and noise; marked in green on the chart;
• MACD Indicator (Moving Average Convergence/Divergence) Fast EMA with a 12-day period; Slow EMA with a 26-day period. SMA with a 9-day period;
• Bollinger Bands: 20-day period;
• Non-commercial traders are speculators such as individual traders, hedge funds, and large institutions who use the futures market for speculative purposes and meet certain requirements;
• Long non-commercial positions represent the total number of long positions opened by non-commercial traders;
• Short non-commercial positions represent the total number of short positions opened by non-commercial traders;
• The total non-commercial net position is the difference between short and long positions of non-commercial traders.
The material has been provided by InstaForex Company - www.instaforex.com
http://dlvr.it/SX4xBb
Comments
Post a Comment