Long-term perspective.
The EUR/USD currency pair had a decrease of about 60 points this week. While this may not seem like a significant drop, it becomes more meaningful when you consider that the Euro has been steadily declining for the past two months, resulting in an overall loss of around 600 points since the start of 2023. Interestingly, the Euro has maintained a relatively high value during this period, raising questions about what's been driving its elevated valuation.
In contrast, the US dollar has been on a downward trend for almost a year, despite the Federal Reserve raising interest rates more aggressively and swiftly compared to the ECB. We've consistently pointed out the paradoxical nature of this situation and warned that a correction would likely happen.
Now, we're witnessing a situation that's quite different from what we saw in the past year. As the ECB increases interest rates, the Euro weakens, regardless of fundamental and macroeconomic factors. This pattern resembles how the US dollar behaved over the past 12 months. This suggests that the market has already factored in the tightening of monetary policy in both the US and the Eurozone, which has diminished the incentive to buy the Euro.
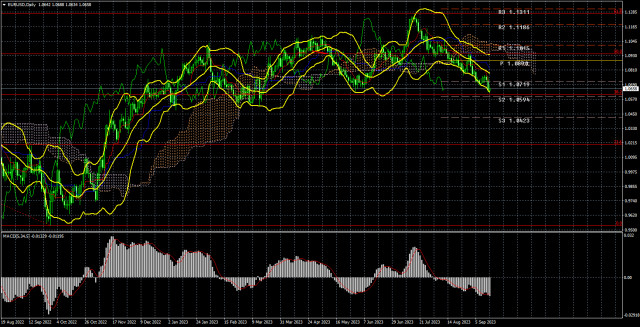
The price is getting closer to a significant level we've mentioned frequently - the Fibonacci level of 38.2% at 1.0609. While there might be a temporary bounce and slight upward movement from this point, we anticipate it being breached in the medium term, leading to further declines for the pair.
This week, there were very few significant events, and among them, only a handful had any notable impact on the pair's movement.
The price is now approaching a critical level we have mentioned frequently – the Fibonacci level of 38.2% at 1.0609. While there might be a temporary rebound and slight upward movement from this point, we anticipate it being breached in the medium term, leading to further declines for the pair.
This week, there were very few significant events, and among them, only a handful had any notable impact on the pair's movement.For example, on Wednesday, the US inflation report was published, and what did it yield? The pair's volatility on that day was 50 points, and the market couldn't even figure out how to interpret the numbers. Core inflation decreased while headline inflation increased. What does this mean for the upcoming Federal Reserve meeting? All secondary reports during the week had virtually no influence on the pair's movement.
COT Analysis.
On Friday, the new COT report for September 12 was released. Over the last 12 months, the COT reports have accurately reflected market developments. The net position of large traders (the second indicator) began to rise in September 2022, roughly at the same time the European currency started to climb. The net position has barely increased in the last 6–7 months, but the euro remains relatively high while declining slowly. Nonetheless, it is declining. Any significant decline begins with a small one. Currently, the net position of non-commercial traders in "bullish" positions remains fairly strong, but the euro is gradually sliding downward.
We have previously pointed out to traders that a relatively high "net position" value can suggest the end of an uptrend. That time may have come. The red and green lines have significantly diverged from each other, a common precursor to the end of a trend, and they have even begun to converge. Therefore, we still anticipate the end of the uptrend. During the last reporting week, the number of Buy contracts among "Non-commercial" traders decreased by 23.3 thousand, while the number of shorts decreased by 0.2 thousand. Consequently, the net position fell by 23.1 thousand contracts. The number of Buy contracts is higher than the number of Sell contracts among non-commercial traders by 113 thousand, but the gap is narrowing, which is encouraging. In principle, even without COT reports, it is now evident that the European currency should continue to decline, but the COT reports support this scenario.
Fundamental Events Overview:
There were few macroeconomic events this week, and those that did affect the pair's movement were almost non-existent. How can one search for reports that influenced the euro or the dollar when, for four out of five days, volatility did not exceed 50 points? There was a report on industrial production in the European Union, and Christine Lagarde spoke twice. The head of the ECB failed to convince the market to maintain a "hawkish" stance. Despite raising the key interest rate for the tenth consecutive time, the euro plummeted because the market had already priced in all the tightening measures in advance and now expects only a monetary policy easing from the European regulator. American reports and publications also had virtually no impact on the pair's decline.
Trading plan for the week of September 18–22:
* In the 24-hour timeframe, the pair continues to move downward. It previously rebounded from the Senkou Span B line and the 50.0% Fibonacci level, which served as a strong signal for new sales. Thus, there are no grounds for buying at the moment. Theoretically, the price may bounce off the 38.2% Fibonacci level, but what's the point of buying in a downtrend? We do not expect a strong rise in the euro in any case.
* As for selling the EUR/USD pair, they are currently more promising. However, the first and nearest target we have been discussing for many months has already been almost reached – 1.0609 (38.2% Fibonacci). Further decline depends on whether this level is overcome or not. In case of overcoming it, we will expect a decline by the end of the year to the level of 1.0210 (23.6% Fibonacci). The euro can count on growth no earlier than the end of the year when the Federal Reserve starts considering a relaxation of its monetary policy.
Explanations for the illustrations:
Price support and resistance levels, Fibonacci levels – these are the targets when opening buys or sells. You can place Take Profit levels near them.
Indicators: Ichimoku (default settings), Bollinger Bands (default settings), MACD (5, 34, 5).
Indicator 1 on COT charts – the size of the net position for each category of traders.
Indicator 2 on COT charts – the size of the net position for the "Non-commercial" group.
The material has been provided by InstaForex Company - www.instaforex.com
http://dlvr.it/SwBdyP

Comments
Post a Comment