- Get link
- X
- Other Apps
- Get link
- X
- Other Apps
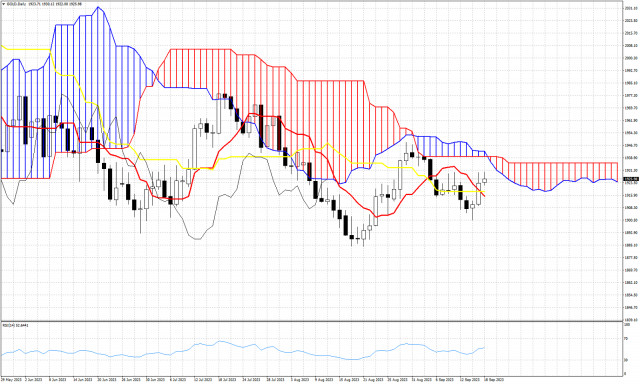
Gold price is trading around $1,925. In Ichimoku cloud terms ,trend remains bearish as price is still below the Kumo (cloud). Price is trading above the tenkan-sen (red line indicator) and the kijun-sen (yellow line indicator). The Chikou span (black line indicator) is moving above the candlestick pattern (bullish). Some of the indicators in the daily chart give some hints of a possible trend reversal. However the most important obstacle is the Kumo (cloud) resistance at $1,943. A daily close above this level would be an important bullish sign. At $1,915-18 we find short-term support. Bulls do not want to see price make a daily close below this support area.The material has been provided by InstaForex Company - www.instaforex.com
http://dlvr.it/SwH44n
http://dlvr.it/SwH44n
- Get link
- X
- Other Apps

Comments
Post a Comment