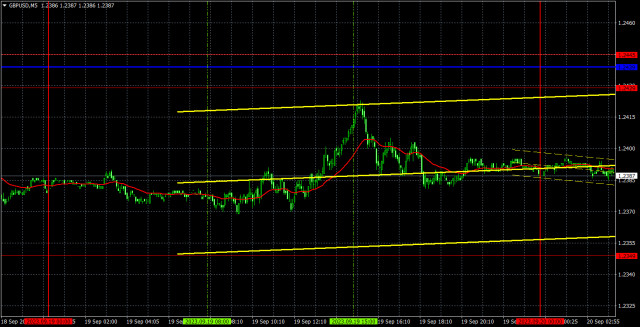
Analysis of GBP/USD 5M
On Tuesday, GBPUSD remained subdued. The chart above may make it seem like the price was moving fairly actively and with volatility, but it's just an illusion. It only covered 55 pips from the day's low to the high, which is quite meager for the pound. Therefore, it didn't make any sense for the pound to rise in the middle of the European trading session. Moreover, it wasn't triggered by any report or event, as the UK calendar was basically empty yesterday. Today, the UK will release important reports, but this doesn't guarantee increased movement and higher volatility.
Let's assume that inflation in the UK matches the forecasts; then, there will be nothing for the market to react to. Accordingly, until the Federal Reserve announces the results of its meeting, which are, for the most part, already known, the pair may continue to remain relatively muted. The same goes for the evening; if Fed Chair Jerome Powell doesn't announce anything significant, the pair will simply move up and down and return to its initial positions.
There were no trading signals, and that was a good thing because it would be difficult to expect any profits with just a 50-pip volatility. However, there could be many false signals. But yesterday, the price didn't touch any important lines or levels along its path.
COT report:
According to the latest COT report on GBP/USD, the Non-commercial group has 4,700 long positions and 4,900 short positions. Thus, the net position of non-commercial traders decreased by 200 contracts over the week. The net position indicator has been steadily increasing over the past 12 months and remains high, while the British pound is still not in a hurry to fall sharply. However, the pound sterling has started to fall in the last two months. If the pound had been rising for a year before, why should it start to fall rapidly now? Perhaps we are at the very beginning of a protracted downtrend.
The British currency has jumped by a total of 2,800 pips from its absolute lows reached last year. All in all, it has been a stunning rally without a strong downward correction. Thus, further growth would be utterly illogical. We're not against the upward trend. We just believe GBP/USD needs a good downward correction first and then assess the factors supporting the dollar and the pound. The Non-commercial group currently holds a total of 97,400 longs and 51,100 shorts. We remain skeptical about the long-term growth of the British currency, as we do not see any fundamental and macroeconomic reasons for it.
Analysis of GBP/USD 1H
On the 1H chart, GBP/USD continues its weak downward movement. The pound sterling is still poised to decline and can't correct upwards. It still has to go through the meetings of the Bank of England and the Federal Reserve this week. The British pound may very well sink even lower as the market is currently not interested in the uptrend for obvious reasons. This is entirely reasonable since the pound remains overbought and lacks a fundamental backdrop for a bullish move.
On September 20, traders should pay attention to the following key levels: 1.2188, 1.2269, 1.2349, 1.2429-1.2445, 1.2520, 1.2605-1.2620, 1.2693, 1.2786, 1.2863. The Senkou Span B (1.2573) and Kijun-sen (1.2439) lines can also be sources of signals, e.g. rebounds and breakout of these levels and lines. It is recommended to set the Stop Loss orders at the breakeven level when the price moves in the right direction by 20 pips. The lines of the Ichimoku indicator can move during the day, which should be taken into account when determining trading signals. There are support and resistance levels that can be used to lock in profits.
UK inflation data is due today, which could be quite influential and can directly influence the Bank of England's rate decision tomorrow. This report has the potential to move the market today. The main item on today's agenda is the results of the FOMC meeting and the press conference with Fed Chair Jerome Powell. However, this is in the late evening.
Description of the chart:
Support and resistance levels are thick red lines near which the trend may end. They do not provide trading signals;
The Kijun-sen and Senkou Span B lines are the lines of the Ichimoku indicator, plotted to the 1H timeframe from the 4H one. They provide trading signals;
Extreme levels are thin red lines from which the price bounced earlier. They provide trading signals;
Yellow lines are trend lines, trend channels, and any other technical patterns;
Indicator 1 on the COT charts is the net position size for each category of traders;
Indicator 2 on the COT charts is the net position size for the Non-commercial group.
The material has been provided by InstaForex Company - www.instaforex.com
http://dlvr.it/SwMtvl

Comments
Post a Comment