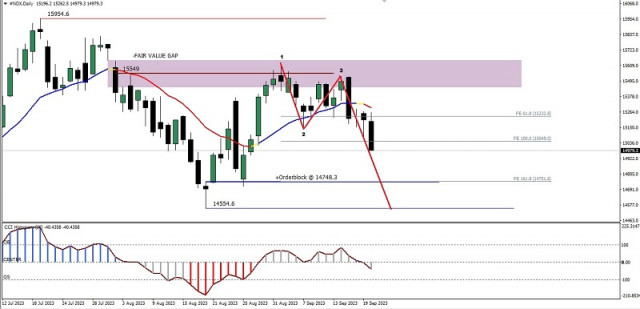
With the CCI indicator successfully breaking below three important levels (100, 0, & -100) on its daily chart and the price movement being below the WMA (20), and the emergence of the Bearish 123 pattern which coincidentally intersects within the Bearish Fair Value Gap area level, then, in the next few days, as long as there is no upward correction past level 15640.6, #NDX will have the opportunity to continue its decline to level 14748.3 as its main target and level 14554.6 as its second target.
(Disclaimer)The material has been provided by InstaForex Company - www.instaforex.com
http://dlvr.it/SwQLXH
http://dlvr.it/SwQLXH

Comments
Post a Comment