Trend analysis
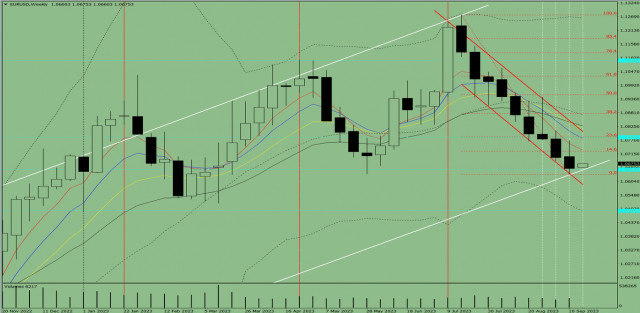
EUR/USD may move upward this week, starting from the level of 1.0656 (closing of the last weekly candle) to the 14.6% retracement level of 1.0725 (red dashed line). After reaching this price, the pair will climb towards the 23.6% retracement level of 1.0783 (red dashed line).
Fig. 1 (weekly chart)
Comprehensive analysis:
Indicator analysis - upward
Fibonacci levels - upward
Volumes - upward
Candlestick analysis - upward
Trend analysis - upward
Bollinger bands - downward
Monthly chart - upward
Conclusion: The indicators point to an upward movement in EUR/USD.
Overall conclusion: The pair will have a bullish trend, with no first lower shadow on the weekly white candle (Monday - upward) and no second upper shadow (Friday - upward).
So during the week, euro will rise from 1.0656 (closing of the last weekly candle) to the 14.6% retracement level of 1.0725 (red dashed line), and then move to the 23.6% retracement level of 1.0783 (red dashed line).
Alternatively, it could continue moving downwards from 1.0656 (closing of the last weekly candle) to the support line at 1.0592 (thick red line), followed by a rise to the 14.6% retracement level of 1.0725 (red dashed line).The material has been provided by InstaForex Company - www.instaforex.com
http://dlvr.it/SwG8FT

Comments
Post a Comment