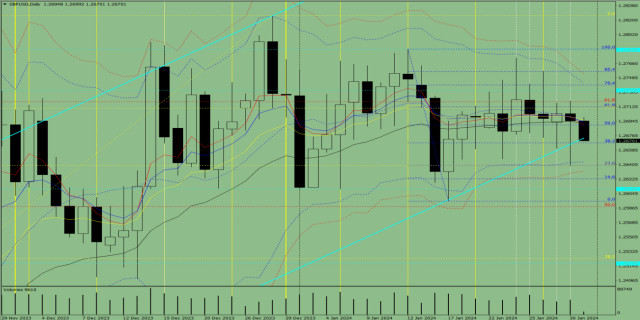
The GBP/USD currency pair moved downward on Tuesday, testing the 23.6% pullback level at 1.2639 (yellow dotted line), then moved upward, closing the daily candle at 1.2695. Today, the market may continue to move down. Economic calendar news is expected at 13:15, 15:30, 19:00, and 19:30 UTC (dollar).
Trend analysis (Fig. 1).
On Wednesday, the market may move downward from the level of 1.2695 (closing of yesterday's daily candle) to 1.2667, the 38.2% pullback level (blue dotted line). In the case of testing this level, an upward movement is possible with a target of 1.2690, the 50% pullback level (blue dotted line).
Fig. 1 (daily chart).
Comprehensive analysis:
* Indicator analysis – down;
* Fibonacci levels – down;
* Volumes – down;
* Candlestick analysis – down;
* Trend analysis – down;
* Weekly chart – down;
* Bollinger bands – down.
General conclusion: Today, the price may move downward from the level of 1.2695 (closing of yesterday's daily candle) to 1.2667, the 38.2% pullback level (blue dotted line). In the case of testing this level, an upward movement is possible with a target of 1.2690, the 50% pullback level (blue dotted line).
Alternatively, the price may move downward from the level of 1.2695 (closing of yesterday's daily candle) to 1.2667, the 38.2% pullback level (blue dotted line). In the case of testing this level, a continued downward movement is possible with a target of 1.2639, the 23.6% pullback level (yellow dotted line). From this level, the price may move up.The material has been provided by InstaForex Company - www.instaforex.com
http://dlvr.it/T26kL3
Comments
Post a Comment