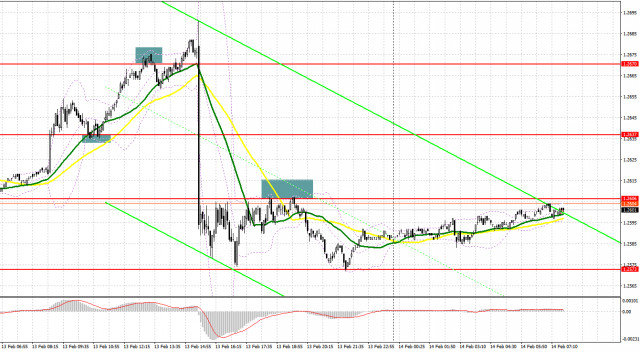
Yesterday, GBP/USD generated several signals to enter the market. Now let's look at the 5-minute chart and try to figure out what actually happened. In my morning forecast, I indicated the level of 1.2637 and planned to make decisions on entering the market from there. A breakout and upward retest of 1.2637 generated a buy signal, which sent the pair up by more than 35 pips. In the afternoon, a false breakout at 1.2670 produced a sell signal. As a result, the pair was down by more than 80 pips.
For long positions on GBP/USD:
Yesterday's UK labor market data reminds us that the Bank of England's rates need to be kept at current highs for as long as possible. This morning, the UK Consumer Price Index will be published. If inflation increases, the pound may quickly regain its position, which it lost yesterday after the US inflation data. But if inflation falls, GBP/USD will likely fall further.
I plan to look for buying opportunities on dips, ensuring that buyers are present around 1.2573. A false breakout of this level, similar to what I discussed above, would serve as a buy signal, aiming for a recovery towards 1.2651, where the moving averages are currently aligned in favor of sellers. A breakout and consolidation above this range will strengthen the demand for the pound and open the way to 1.2652, which would be a strong correction for the pair. The ultimate target will be the 1.2690 high where I intend to take profit. In a scenario where GBP/USD falls and there are no buyers at 1.2573, we might see another pound sell-off, which will revive the bear market and cross out all the bulls' plans for further correction. In such a scenario, only a false breakout near the next support at 1.2543 would provide an entry signal. I would immediately go long on a bounce from the 1.2519 low, bearing in mind an intraday correction of 30-35 pips.
For short positions on GBP/USD:
Sellers are in control of the market and their goal is to keep the pair below the nearest resistance at 1.2615. In case GBP/USD attempts to recover in the first half of the day, I plan to sell GBP/USD only after forming a false breakout, as this would confirm the presence of major sellers in the market, creating a sell signal that will give bears a chance to move the price down to the area of 1.2573 - yesterday's low. Only a breakout and a retest from below will deal a more serious blow to the buyers' positions, leading to the removal of stop orders and opening the way to 1.2543, where I anticipate big buyers to show up. The next target would be low of 1.2519, where I plan to take profits. If GBP/USD grows and there are no bears at 1.2615, and if we receive strong UK inflation data, the bulls will try to regain the market's favor in hopes of a correction. In such a case, I will postpone sales until the price performs a false breakout at 1.2652. If there is no downward movement there, I will sell GBP/USD on a bounce right from 1.2690, considering a downward correction of 30-35 pips within the day.
COT report:
In the COT report (Commitment of Traders) for February 6, we find an increase in both long and short positions. Although traders already have a clear view of the Bank of England's future policy, which intends to actively control inflation, the pound is not in a rush to show growth. Recent statements by BoE officials indicate a soft wait-and-see stance that can change at any moment – if, of course, the data allows. In the near future, we can look forward to UK reports on the labor market, wage growth, and inflation, which can significantly change the balance of power in the market. But don't forget to consider the Federal Reserve's wait-and-see position, so uncertainties are much greater now than before. The latest COT report said that long non-commercial positions rose by 6,437 to 83,936, while short non-commercial positions increased by 6,115 to 49,461. As a result, the spread between long and short positions decreased by 2,374.
Indicator signals:
Moving Averages
Trading below the 30- and 50-day moving averages indicates a possible decline in the pair.
Please note that the time period and levels of the moving averages are analyzed only for the H1 chart, which differs from the general definition of the classic daily moving averages on the D1 chart.
Bollinger Bands
If GBP/USD falls, the indicator's lower boundary near 1.2555 will serve as support.
Description of indicators:
• A moving average of a 50-day period determines the current trend by smoothing volatility and noise; marked in yellow on the chart;
• A moving average of a 30-day period determines the current trend by smoothing volatility and noise; marked in green on the chart;
• MACD Indicator (Moving Average Convergence/Divergence) Fast EMA with a 12-day period; Slow EMA with a 26-day period. SMA with a 9-day period;
• Bollinger Bands: 20-day period;
• Non-commercial traders are speculators such as individual traders, hedge funds, and large institutions who use the futures market for speculative purposes and meet certain requirements;
• Long non-commercial positions represent the total number of long positions opened by non-commercial traders;
• Short non-commercial positions represent the total number of short positions opened by non-commercial traders;
• The non-commercial net position is the difference between short and long positions of non-commercial traders.The material has been provided by InstaForex Company - www.instaforex.com
http://dlvr.it/T2kTls
Comments
Post a Comment