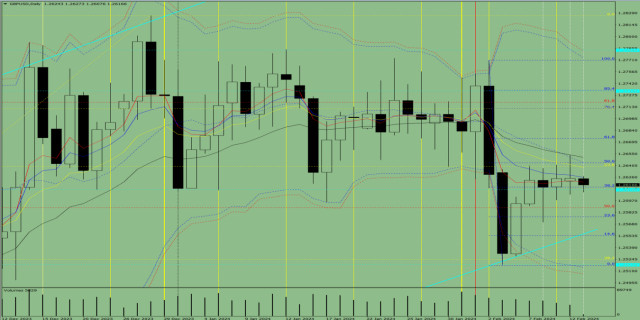
Trend analysis (Fig. 1).
The GBP/USD currency pair may move downward from the level of 1.2625 (closing of yesterday's daily candle) to test the historical support level of 1.2611 (blue dotted line). Upon reaching this level, an upward movement is possible to test the 23.6% pullback level at 1.2639 (yellow dotted line).
Fig. 1 (daily chart).
Comprehensive analysis:
* Indicator analysis – up;
* Volumes – up;
* Candlestick analysis – up;
* Trend analysis – up;
* Bollinger bands – up;
* Weekly chart – up.
General conclusion: Today, the price may move downward from the level of 1.2625 (closing of yesterday's daily candle) to test the historical support level of 1.2611 (blue dotted line). Upon reaching this level, an upward movement is possible to test the 23.6% pullback level at 1.2639 (yellow dotted line).
Alternatively, from the level of 1.2625 (closing of yesterday's daily candlestick), the price may move downward to test the 50% pullback level at 1.2588 (red dotted line). Upon reaching this level, an upward movement is possible to test the 23.6% pullback level at 1.2639 (yellow dotted line).The material has been provided by InstaForex Company - www.instaforex.com
http://dlvr.it/T2gtnK
Comments
Post a Comment