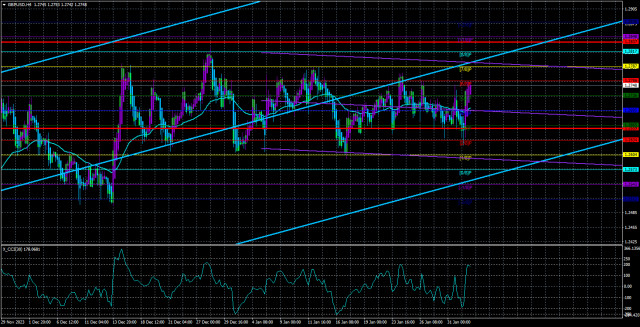
The GBP/USD currency pair continues to trade within the sideways channel of 1.2611-1.2787. Yesterday and the day before could have been significant for the British pound, which has been in a flat for a month and a half, but they weren't. After the Fed meeting, we saw the dollar rise; before the Fed meeting, the dollar fell, and after the Bank of England meeting, the pound rose. Thus, we observed opposite movements within the same sideways channel for two days.
It is worth noting that the results of the meetings of both central banks were as contradictory as the movements of the GBP/USD pair. If the Fed and Jerome Powell could not answer "when is the first rate cut planned," then the Bank of England - even more so. Powell hinted to the market that now everything will depend not only on inflation but also on the state of the labor market and the economy. In other words, he added a few more "ifs" to the general equation. Now, market participants must look not only at inflation and the pace of its slowdown to try to predict the timing of the first easing. Now, they must also analyze and compare labor market data with inflation data. How will the Federal Reserve's monetary committee interpret this information?
What became known after the meeting of the British regulator? First, the key rate remained unchanged, but no one expected an increase. Second, the number of Committee members voting "for" the increase decreased to 2 out of 9. Third, one of the managers unexpectedly voted "for" a rate cut. Thus, the voting results can be called unexpected and moderately dovish. However, these dovish voting results did not pressure the British pound.
The accompanying statement of the Bank reflected the maintenance of a hawkish sentiment. In other words, the British regulator should have signaled to the market that it might start lowering the rate soon. Thus, the pound, which had just approached the lower border of the sideways channel, immediately moved away from it. We are aware that in the near future, there will be a new attempt to test this level (possibly even successful), but we (and not only us) expected the flat to end on truly important and significant events. Instead, we have every chance to see an exit from the sideways channel on some boring Monday when no one expects it. And it's good if we see it because the flat has already become frankly tedious.
There is nothing more to note about yesterday. It is fine to compare the economies of the United States and Great Britain once again or try to guess when one or another central bank will start easing monetary policy. It doesn't matter for the British pound now, as it remains flat. Until it leaves the designated channel, the entire fundamental background will only provoke movements within the channel.
Even the boundaries of this channel (to trade on rebounds from them) still need to be worked out. During the last upward movement on January 24, a local maximum was set 13 points below the upper channel boundary. Yesterday, the pair fell to the level of 1.2624, which is located 13 points above the lower channel boundary. That is, even standard signals for the flat do not form. The situation with the pound remains maximally unfavorable.
The average GBP/USD pair volatility for the last five trading days is 89 points. For the pound/dollar pair, this value is considered "average." On Friday, February 2nd, we expect movements within the range limited by the levels of 1.2659 and 1.2837. The downward reversal of the Heiken Ashi indicator will indicate a new downward movement phase within the sideways channel.
Nearest support levels:
S1 - 1.2726
S2 - 1.2695
S3 - 1.2665
Nearest resistance levels:
R1 - 1.2756
R2 - 1.2787
R3 - 1.2817
Trading recommendations:
As we expected, the GBP/USD currency pair has resumed its movement towards the level of 1.2787, which acts as the upper boundary of the sideways channel. However, we are reminded again that there is currently a flat market, meaning that movements can be multidirectional and unpredictable. The price often overcomes the moving average, so it has only a formal nature. We consider it reasonable to consider short positions with targets of 1.2634 and 1.2604 near 1.2787. If there is a breakout beyond the sideways channel, one should not rush to conclusions, as on Thursday and Friday, the market will trade impulsively, driven by emotions due to a strong fundamental and macroeconomic background.
Explanations for the illustrations:
Linear regression channels - help determine the current trend. If both are directed in the same direction, the trend is strong.
The moving average line (settings 20.0, smoothed) - determines the short-term trend and the direction in which trading should be conducted.
Murray levels - target levels for movements and corrections.
Volatility levels (red lines) - the probable price channel in which the pair will spend the next day, based on current volatility indicators.
CCI indicator - its entry into the oversold area (below -250) or overbought area (above +250) indicates that a trend reversal in the opposite direction is approaching.The material has been provided by InstaForex Company - www.instaforex.com
http://dlvr.it/T2CMQ2
Are you a forex trader or affiliate marketter that wants to trade forex or make money online.we have the best tips for you here.
Subscribe to:
Post Comments (Atom)
1 in 7 prop firms closed in 2024: Brokeree Solutions shares insights - FX News Group
Using publicly available data, Brokeree collected and analyzed information about: Country of registration;; Trading platforms utilized;; Fe...
-
IS CFD TRADING WORTH ITTORIAL: Trading Stock CFDs Worth It? 📝 A topic that is only tangential to Forex, the question of whether to trade st...
-
FX Eagle Dashboard Forex System provides extraordinary trading assistance for its users. THE CURRENCY MATRIX. The indicators are all avai...
-
http://dlvr.it/TF2Sfb

No comments:
Post a Comment