On Monday, EUR/USD once again showed movements that were far from ideal. In the European session and half of the US session, the pair was trading lower and broke through the level of 1.0823, which it had bounced off several times before. However, in the middle of the US session, it turned upwards and started an equally strong upward movement. The pair closed the day above the level of 1.0823, and on higher timeframes, the breakout of 1.0823 can be considered a false signal.
Nevertheless, a breakout of this level did occur, which could be a good sign for maintaining the downtrend. There were no important reports on Monday, but three representatives of the European Central Bank spoke. Luis de Guindos was the least specific and said that the "ECB will cut interest rates when we are sure that inflation meets our 2% goal." His colleagues Centeno and Kazimir were more specific, but their comments were openly contradictory. One stated that it is better to start lowering the rate before June, the other said that rate cuts should not begin before June. Therefore, there is no more clarity in the ECB rate situation.
The weak downtrend persists, and this week we can expect strong movements. We hope that they will lead to a trend rather than another flat.
The trading signals on Monday left much to be desired. Despite the strength of the level of 1.0823, during the day, the price managed to overcome it four times. Therefore, it was not possible to make a profit – all four signals turned out to be false. Only the first two could be worked out.
COT report:
The latest COT report is dated January 23. As seen in the charts above, it is clear that the net position of non-commercial traders has been bullish for quite some time. To put it simply, the number of long positions is much higher than the number of short positions. This should support the euro, but we still do not see fundamental factors for the euro to strengthen further. In recent months, both the euro and the net position have been rising. However, over the past few weeks, big players have started to reduce their long positions, and we believe that this process will continue.
We have previously pointed out that the red and green lines have moved apart from each other, which often precedes the end of a trend. At the moment, these lines are still far apart. Therefore, we support the scenario in which the euro should fall and the uptrend must end. During the last reporting week, the number of long positions for the non-commercial group decreased by 9,100, while the number of short positions increased by 6,600. Accordingly, the net position fell by 15,700. The number of buy contracts is still higher than the number of sell contracts among non-commercial traders by 89,000 (it was 104,000). The gap is quite large, and even without COT reports, it is clear that the euro should continue to fall.
Analysis of EUR/USD 1H
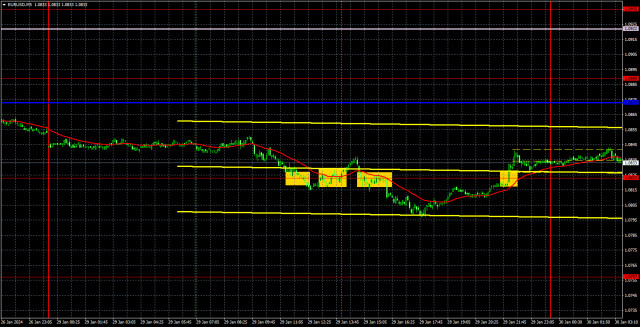
On the 1-hour chart, EUR/USD has broken the level of 1.0823, so we can expect the downtrend to resume after two weeks of consolidation. The price is below the Kijun-sen and Senkou Span B lines. However, this week, we can look forward to a lot of important reports and events, so you should be cautious when opening any trades.
Today, we believe that the price may simply return to the critical line once again. If the price bounces from it, we will consider new short positions with 1.0823 and 1.0757 as the targets. You may consider long positions if the price has settles above the Kijun-sen and we can use Senkou Span B as the target.
On January 30, we highlight the following levels for trading: 1.0658-1.0669, 1.0757, 1.0823, 1.0889, 1.0935, 1.1006, 1.1092, 1.1137, 1.1185, 1.1234, 1.1274, as well as the Senkou Span B (1.0906) and Kijun-sen (1.0865) lines. The Ichimoku indicator lines can move during the day, so this should be taken into account when identifying trading signals. Don't forget to set a breakeven Stop Loss if the price has moved in the intended direction by 15 pips. This will protect you against potential losses if the signal turns out to be false.
On Tuesday, the eurozone will publish the GDP report for the fourth quarter, and the US will release the JOLTs Job Openings report. Both reports are quite important, so the market may react to them.
Description of the chart:
Support and resistance levels are thick red lines near which the trend may end. They do not provide trading signals;
The Kijun-sen and Senkou Span B lines are the lines of the Ichimoku indicator, plotted to the 1H timeframe from the 4H one. They provide trading signals;
Extreme levels are thin red lines from which the price bounced earlier. They provide trading signals;
Yellow lines are trend lines, trend channels, and any other technical patterns;
Indicator 1 on the COT charts is the net position size for each category of traders;
Indicator 2 on the COT charts is the net position size for the Non-commercial group.The material has been provided by InstaForex Company - www.instaforex.com
http://dlvr.it/T23vvC

No comments:
Post a Comment