GBP/USD showed a decent downward movement on Tuesday, which, however, quickly ended, and the pair bounced back up. Therefore, the same judgment applies to both the euro and the pound. The pair is slowly sliding with frequent rebounds to the lower boundary of the sideways channel at 1.2611-1.2787. Since the flat phase persisted for a month and a half, we can't draw new technical conclusions at the moment. The Ichimoku indicator lines are weak, and strong signals are not forming around them.
Yesterday, there were no interesting events in the UK, and in the US, the JOLTs report on job openings in December was published. Its value exceeded the forecast by 0.25 million, so the dollar strengthened for a short period. However, in general, the technical picture did not change. The dollar rose yesterday, and today the pound may rise. The flat persists.
Tonight and tomorrow (as well as on Friday during the US session), we can expect increased volatility and the pair may even leave the sideways channel. However, for this to happen, all the remaining fundamental and macroeconomic events (or at least the majority) must unequivocally support the dollar. And only then will we be able to expect a breakthrough of the 1.2605-1.2620 area, as well as further downward movement.
There were only two trading signals on Tuesday, and both were formed around weak Kijun-sen and Senkou Span B lines at this time. Traders could open short positions during the European session, but closing them at a profit was quite difficult, as the pair did not reach the nearest target level by the evening and returned to the Senkou Span B line. The profit could only be small if traders manually closed the deals.
COT report:
COT reports on the British pound show that the sentiment of commercial traders has been changing quite frequently in recent months. The red and green lines, representing the net positions of commercial and non-commercial traders, often intersect and, in most cases, are close to the zero mark. According to the latest report on the British pound, the non-commercial group opened 6,300 buy contracts and 5,800 short ones. As a result, the net position of non-commercial traders increased by 500 contracts in a week. The fundamental backdrop still does not provide a basis for long-term purchases on the pound.
The non-commercial group currently has a total of 72,600 buy contracts and 41,100 sell contracts. Since the COT reports do not provide an accurate forecast of the market's behavior at the moment, we need to pay close attention to the technical picture and economic reports. However, even these types of analysis are currently secondary because, despite everything, the market still maintains a bullish bias towards the pound, and the price has been in a flat range for the second month. The technical analysis suggests that there's a possibility that the pound could show a pronounced downward movement (but there are no clear sell signals yet), and for a long time now, the economic reports have also been significantly stronger in the United States than in the United Kingdom, but this has not benefited the dollar.
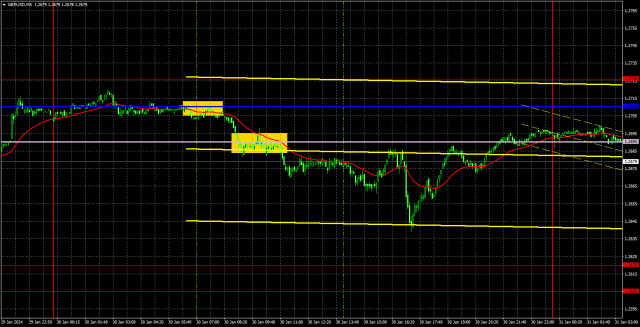
Analysis of GBP/USD 1H
On the 1H chart, GBP/USD continues to trade within the sideways channel of 1.2611-1.2787. The price has been unable to leave it for a month and a half. Therefore, it would not be surprising if the British pound continues to stay within the flat today.
On Wednesday, the pair has a higher chance of rising than falling, but it is considered impractical to open positions at the moment. The price continues to be located precisely in the middle of the sideways channel, and there is no point in expecting strong signals near the Senkou Span B and Kijun-sen lines.
As of January 31, we highlight the following important levels: 1.2215, 1.2269, 1.2349, 1.2429-1.2445, 1.2513, 1.2605-1.2620, 1.2726, 1.2786, 1.2863, 1.2981-1.2987. The Senkou Span B lines (1.2684) and Kijun-sen (1.2698) lines can also serve as sources of signals. Don't forget to set a breakeven Stop Loss to breakeven if the price has moved in the intended direction by 20 pips. The Ichimoku indicator lines may move during the day, so this should be taken into account when determining trading signals.
Today, there are no significant events lined up in the UK. The US economic docket features the release of the ADP report on private-sector employment. The results of the FOMC meeting will be announced in the evening, and Federal Reserve Chair Jerome Powell will speak. After these events, volatility may sharply increase, but the GBP/USD pair needs a clear and strong decline to have a chance of breaking out of the sideways channel.
Description of the chart:
Support and resistance levels are thick red lines near which the trend may end. They do not provide trading signals;
The Kijun-sen and Senkou Span B lines are the lines of the Ichimoku indicator, plotted to the 1H timeframe from the 4H one. They provide trading signals;
Extreme levels are thin red lines from which the price bounced earlier. They provide trading signals;
Yellow lines are trend lines, trend channels, and any other technical patterns;
Indicator 1 on the COT charts is the net position size for each category of traders;
Indicator 2 on the COT charts is the net position size for the Non-commercial group.The material has been provided by InstaForex Company - www.instaforex.com
http://dlvr.it/T26N6Y

No comments:
Post a Comment